Smog Lake City
In this section, I will be discussing the growing problem that Utahns across the Salt Lake Valley are subject to every winter: inversion. I will define what an inversion is, who it affects, and different measures that Utahns can take to prevent poor air quality.
|
What is an inversion?
An inversion is a weather phenomenon that occurs typically during the winter months when the normal conditions of the atmosphere become inverted. Instead of having cool air above and warm air below, the air becomes inverted and a layer of cold air becomes trapped under a blanket of warm air. By having this 'blanket effect,' pollutants have no way of escaping and diffusing into the atmosphere. The cold air holds in pollutants and creates a harmful smog that can last for weeks at a time.

Photo courtesy of Intermountain Primary Children's Hospital.
http://www.primarychildrenshospitalblog.org/the-air-we-breathe-protecting-our-kids-during-an-inversion/
|

Photo courtesy of Buzzle.
http://www.buzzle.com/articles/causes-and-effects-of-temperature-inversion.html
Why Utah?
Due to the geography of the Wasatch Front, the Salt Lake Valley is prone to inversions during the winter months. By having a "bowl shaped" valley, cold, dense air can be easily trapped under a sheet of warmer air and can cause an inversion to take place. When this happens, particles and pollutants become trapped and more concentrated. This leads to the build up of smog and creates poor air quality conditions across the valley.
In Utah, inversions are known to last for weeks at a time. The only way to disrupt an inversion is by a strong storm. |

A view from Little Cottonwood Canyon--overlooking the Salt Lake Valley. Here we can see the "bowl shape" valley where cold, polluted air becomes trapped and creates a thick layer of haze that stretches across the valley.
Photo courtesy of Lee Cohen of POWDER Magazine. http://www.powder.com/stories/smog-lake-city/
|
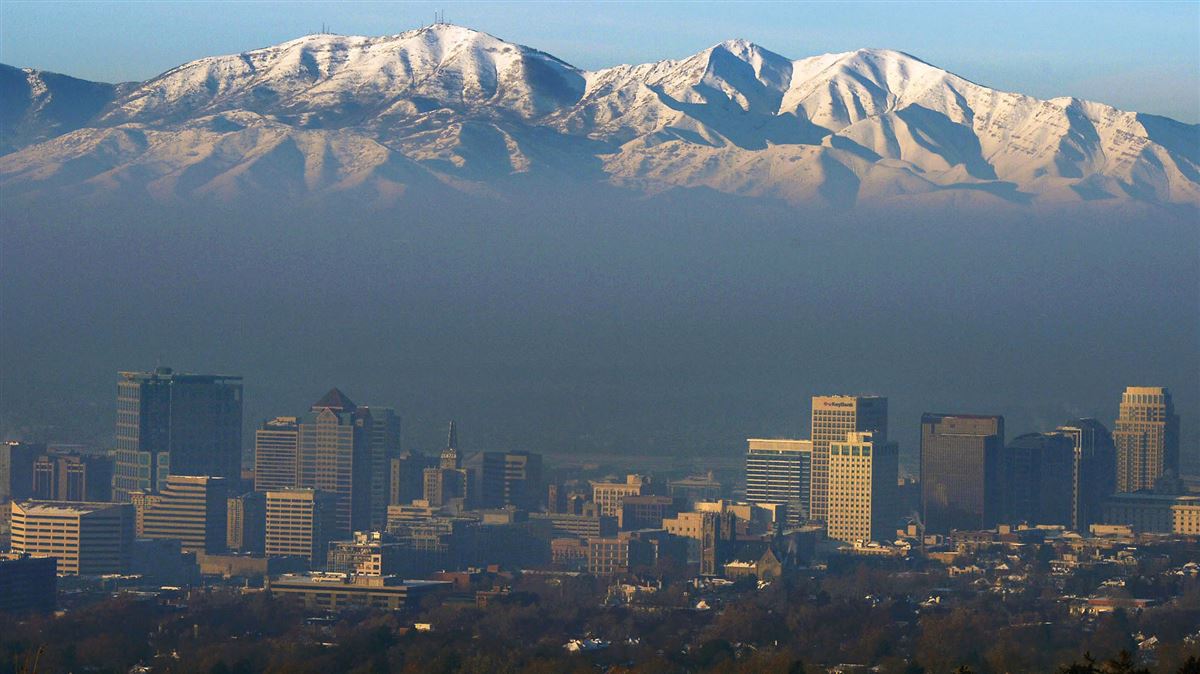
View of Downtown Salt Lake CIty. It is hard to see where the mountains begin due to the build up of pollution during an inversion.
Photo courtesy of Associated Press. http://www.standard.net/Environment/2015/12/08/Groups-call-for-earlier-due-date-on-Utah-s-air-quality-plan
|
|
Inversions can occur in places other than the Salt Lake Valley. Cities such as Los Angeles share the same geographic characteristics where the bowl shaped valley easily traps cold air, causing pollutants to become trapped and creating a thick layer of smog over the city.
In the photo to the right, there is a central valley that is surrounded by two mountain ranges. Cold air settles into the valley and creates a blanket over the valley. With the help of heavily populated areas with high levels of pollution (ie, Los Angeles), smog begins to build up and begins to settle into the valley. |

Photo courtesy of San Joaquin Valley Air Pollution Control District. http://www.valleyair.org/newsed/ca_primer/bigpicture/iiia4.html
|
Who does it affect?
Poor air quality affects everyone. In order to alert the public about the potential hazard that an inversion may have, The Utah Division of Air Quality (DAQ) created a color-coordinated system to indicated the various levels of pollution in the air.

Graph courtesy of Intermountain Healthcare LiveWell. https://intermountainhealthcare.org/blogs/2015/02/know-the-air-quality-index-and-how-to-use-it/
Each color can be broken down into various categories to better alert the public when special precautions should be taking place. Although poor air quality affects everyone, people with lung disease, children, and older adults are especially at risk and can develop serious health problems.

Graph courtesy of Utah Department of Environmental Quality, Division of Air Quality and Utah County Government. http://utahcountyonline.org/News/NewsDetails.asp?ID=124825
What are the facts?
|
In Utah, it's not unlikely to see moderate to unhealthy air quality levels. Just this winter, Salt Lake County had 18 mandatory air action days (red air days) and 28 voluntary air action days (yellow air days) from December 2016 to February 2017 (Utah Department of Environmental Quality). This means that even people who do not have a preexisting condition, such as asthma, were asked to take caution and avoid going outdoors as much as possible.
|

Graph courtesy of Utah Department of Environmental Quality. http://www.airmonitoring.utah.gov/dataarchive/woodburnsummary.pdf
|
Below is an air quality map of Northern Utah from December 2016-February 2017. Here we can see the periods when an inversion is covering the Salt Lake Valley versus when a storm has blown through and cleaned the air. You'll notice that the longer the inversion lasts, the more hazardous the air becomes and the more people at risk of health complications increases.

Graph courtesy of AIRNow Archives. https://airnow.gov/index.cfm?action=airnow.local_city&cityid=186
|
To the left is a time-lapse map of the air quality of the Wasatch Front on January 31st, 2017. As you can see, air quality fluctuates throughout the day, but progressively becomes worse.
The yellow represents moderate conditions. The orange represents unhealthy air for sensitive groups. The red represents unhealthy air for all groups. |
What can be done to prevent inversions?
With the geography of Northern Utah being 'bowl shaped', it is very easy for an inversion to develop. But that doesn't mean nothing can be done to prevent inversions from becoming so harmful and hazardous. Many laws and clean air initiatives have been underway in hopes of educating the public and to prevent the build up of smog across the Wasatch Front. Utah's Clean Air Campaign includes:
|

Photo courtesy of the Washington Times and Rick Bowmer. http://www.washingtontimes.com/news/2015/dec/2/air-quality-issues-topic-of-utah-supreme-court-hea/
|
